
The Real Reason Our Doctors Can’t Flag Early Aging & Decline
If We Rely on “Normal” Lab Ranges, We’ll Miss the First Signs of Decline.

I still go to my GP.
She’s diligent, kind, and always booked solid—20‑minute appointments stacked one after another, often with patients waiting because she never rushes anyone.
Watching her juggle those demands shows that the challenge isn’t a lack of care from doctors, but the structure they’re working inside.
The healthcare system was built to protect populations from disease, not to guide individuals toward longevity.
In that role, it does what it’s designed to do.
But if your goal is to stay ahead of aging, the very design that keeps the system functional also creates limitations.
This is the lens we need to adopt.
Respect the system for what it does well, but recognize that longevity requires a different way of reading the same information—for example, the bloodwork you already get in routine care.
Section 2: Population Logic — Why Normal Ranges Weren’t Built for You and Me
If every subtle shift in lab results were flagged, the healthcare system would seize up.
Current thresholds are set primarily to identify clear pathology—conditions like diabetes, kidney dysfunction, advanced liver damage, anemia, or active infection—rather than to detect early risk.
The priority is ensuring that disease is recognized and managed efficiently within available resources.
Right now, a sub-fraction of routine laboratory results are indicated for follow‑up.
If ranges were tightened to reflect where research shows risk begins, the proportion of abnormal results would rise dramatically. That could mean a majority of patients requiring some form of follow‑up.
Each flagged result triggers a cascade of work:
physician review,
patient communication & appointment scheduling,
consideration of further testing,
documentation & insurance authorization.
Multiply this across millions of test results per day, and the burden quickly surpasses available time and resources.
This does not reflect indifference by physicians.
Rather, it highlights a structural reality: if high‑normal results were indicated as risks, the resulting workload would overwhelm the system.
For individuals pursuing longevity, however, this reality means that early declines often remain outside the scope of what the conventional healthcare system will detect or can act upon.
Section 3: The Protocol Gap — Why Borderline Normal Has No Playbook
Even when physicians recognize concerning patterns in borderline-normal values, the conventional healthcare system provides no structured guidance for interpretation or response.
Guidelines and reimbursement structures are built on binary logic: abnormal values trigger defined diagnostic pathways, while results within the reference range requires no action.
This framework leaves little to no space for the nuanced middle ground where the most actionable health decline occurs.
Consider a physician reviewing results where fasting insulin measures 12 μIU/mL—elevated from the patient’s historical baseline of 6 μIU/mL, but still within the laboratory’s reference range of 2–25 μIU/mL.
The physician probably recognizes this pattern as possible early insulin resistance. Yet clinical guidelines provide no standardized protocol for this scenario.
Insurance systems don’t cover follow-up testing for “normal” results.
There is no established timeframe for reassessment, no clear intervention threshold, and no reimbursement pathway for preventive management.
The likely outcome is clinical limbo: documentation and deferral until values cross the abnormal threshold.

When high-normal values consistently receive no clinical attention, they become psychologically invisible in practice. The cognitive pattern of “normal = no action” becomes ingrained. Over time, this absence of pathways creates a form of institutional “blindness,” where gradual biological shifts remain unaddressed.
The reinforcement runs deeper than individual practice:
Medical education emphasizes pathology recognition over trajectory monitoring.
Board examinations test knowledge of disease states, not prevention protocols.
Continuing medical education mainly focuses on managing established conditions rather than intercepting early decline into possible disease.
The result is inertia.
From the individual’s perspective, this trade-off functions like implicit rationing.
For those like you and me, pursuing longevity, this is the practical reality we must work with.
Section 4: Where System Constraints End and Personal Agency Begins
The limits described above exist because the healthcare system must serve entire populations.
But we as individuals are not bound by those same constraints.
We don’t need to wait for values to cross diagnostic thresholds before paying attention.
By looking at personal baselines, research-informed ranges, and changes that persist over time, it’s possible for us to see meaningful signals long before the system is designed to act.
This perspective doesn’t replace medical care.
It simply emphasizes that longevity requires a different lens: one that interprets “normal” results as part of a trajectory, not a verdict.
So what does this look like in practice?
Section 5: Beyond Standard Labwork Interpretation — Why We Can’t Outsource Early Detection & What We Can Do Instead
As emphasized throughout, conventional medicine excels at diagnosing pathology, but it wasn’t built to guide optimal longevity trajectories.
Take high-sensitivity C-reactive protein (hsCRP) as an example.
On a standard lab report, results may only be flagged when levels are markedly elevated. Yet research shows meaningful cardiovascular and longevity risk emerge below those cutoffs.
Looking at hsCRP through a longevity lens reveals a different picture:
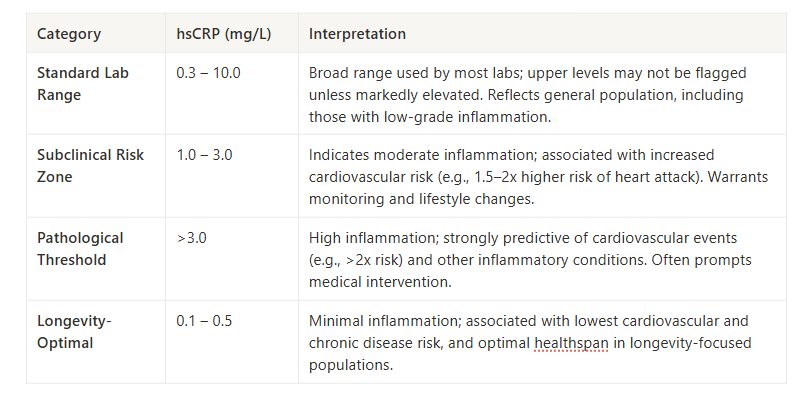
If your hsCRP comes back at 2.0 mg/L, your physician may tell you it’s fine—and within the system’s logic, it is.
But from a longevity perspective, it signals that your inflammatory load is already elevated compared to truly low-risk individuals.
Here’s the empowering shift: you don’t need to wait for values to cross into clinical abnormal ranges.
By considering research-based ranges, you can use hsCRP as an early cue to adjust the levers within your control:
Sleep quality: Even modest reductions in sleep quality or duration can elevate hsCRP.
Dietary patterns (carbohydrates & fiber): Excess refined carbs raise hsCRP, while fiber and gut-supportive foods help lower it.
Dietary patterns (nutrients & phytonutrients): Adequate omega-3 intake and polyphenol-rich foods (berries, olive oil, green tea) are associated with lower inflammation.
Body composition: Abdominal fat is metabolically active and raises baseline inflammation.
Environmental exposures: Air pollutants, poor indoor air quality, and certain toxins can chronically elevate hsCRP.
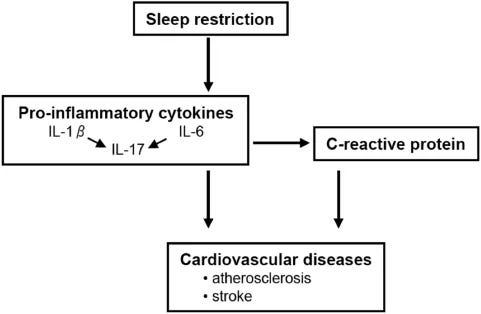
How sleep restriction may increase risk of cardiovascular diseases

Small adjustments in these areas can nudge hsCRP down over time, moving you closer to the longevity-optimal range.
But looking at a single marker is only the first layer. Once you start reading hsCRP differently, complexity emerges:
Personal baselines: A result of 0.8 mg/L may appear fine, but if your historical baseline is 0.2, that’s a fourfold increase—context matters.
Persistence vs. spikes: Was the elevation a one-off after a recent cold, or has it stayed high for months? The answer changes its significance.
Multi-marker drift: hsCRP gains more meaning when paired with related markers. For example, rising hsCRP alongside fasting glucose or triglycerides suggests systemic strain rather than a transient blip.
Marker selection: hsCRP is only one of several inflammation-linked measures. Ferritin, white blood cell count, IL-6, or uric acid can provide complementary signals of immune tone and metabolic stress.
Takeaway: Even a standard marker like hsCRP can become a practical tool when you view it as part of a trajectory instead of a static number.
Acting on small deviations today—through sleep, diet, body composition, and environment—can change your aging trajectory years before the healthcare system could intervene.
The challenge is scaling this perspective across many markers.
How do you weigh shifts in insulin, glucose, and inflammation together? How do you separate lab variation from true decline? And what other markers should you be looking at and acting on before they reach clinical thresholds?
That’s where the Vault SPIRAL System comes in: my framework designed to capture not just one number, but the patterns across time, across markers, relative to your own baseline, and how to take action.
The Vault Before-It’s-Abnormal Lab Intelligence System
—My 6-Part Framework To Detect Early Aging from Routine Labs & Reverse Course (SPIRAL)
Most decline starts inside the normal range. SPIRAL shows you where to act early.
The Prevention Gap Most Adults Face
Everyone understands that prevention is better than treatment.
Yet most people inevitably wait for "abnormal" lab results before taking action on their health.
The challenge isn't knowing that normal ranges aren't optimal—it's knowing how to systematically move from your current normal toward your personal optimal.
SPIRAL bridges that gap.

It transforms routine bloodwork from a static health snapshot into a dynamic tool for early detection and course correction, years before conventional medicine would intervene.
The complete SPIRAL system includes the step-by-step framework plus implementation worksheets, tracking templates, and optimization reference guides for 12 key markers where longevity-optimal ranges differ from standard "normal" ranges.
What You Get With The Vault Before-It's-Abnormal Lab Intelligence System
Module 1. The 6-Part Framework —Early-Detection Framework to Help You Catch Early Health Decline and Reverse Course Without Waiting for a Medical Diagnosis or Adding Complex Bloodwork
12 Critical Markers Analysis: Longevity-optimal ranges for hsCRP, fasting insulin, triglycerides, WBC, and 8 other markers where normal isn’t optimal.
Module 2. The Act-Before-Abnormal Action Guide — The Before-It’s-Abnormal Lab Intelligence System Operating Manual For Acting Early Inside The Normal Range
Personal Biology Manual: Framework for documenting what affects your unique physiology and what reliably restores your baseline.
You can access The Vault Before-It’s-Abnormal Lab Intelligence System Here:
You shouldn’t have to wait for abnormal results to prevent health decline. With The Vault Before-It’s-Abnormal Lab Intelligence System, you won’t.

How To Get Lab Tests:
All SPIRAL markers are standard blood tests that clinicians and national labs can run (relatively inexpensively).
Inside the SPIRAL system, you’ll get a marker list plus access to the Vault SPIRAL Companion Lab Shop, which bundles the recommended markers into ready-to-order panels you can use in most U.S. states.
You can also take the same marker list to your own physician or a national lab service (such as Quest or Labcorp) and run the tests through your usual channels.
Just a reminder that direct self-ordering has state-specific limitations (for example, the Vault Lab Shop is not available for self ordering in NY, NJ, or RI), and different services have different rules, but the portals will automatically show what’s available for your location.

References
Timbrell NE. The Role and Limitations of the Reference Interval Within Clinical Chemistry and Its Reliability for Disease Detection. Br J Biomed Sci. 2024 Feb 28;81:12339. doi: 10.3389/bjbs.2024.12339. PMID: 38481978; PMCID: PMC10932992.
Magni, O., Arnaoutis, G. & Panagiotakos, D. The impact of exercise on chronic systemic inflammation: a systematic review and meta–meta-analysis. Sport Sci Health (2025). https://doi.org/10.1007/s11332-025-01445-3
Docherty, S., Harley, R., McAuley, J.J. et al. The effect of exercise on cytokines: implications for musculoskeletal health: a narrative review. BMC Sports Sci Med Rehabil 14, 5 (2022). https://doi.org/10.1186/s13102-022-00397-2
Aqeel, M.; Forster, A.; Richards, E.A.; Hennessy, E.; McGowan, B.; Bhadra, A.; Guo, J.; Gelfand, S.; Delp, E.; Eicher-Miller, H.A. The Effect of Timing of Exercise and Eating on Postprandial Response in Adults: A Systematic Review. Nutrients 2020, 12, 221. https://doi.org/10.3390/nu12010221
van der Spoel E, Roelfsema F, van Heemst D. Within-Person Variation in Serum Thyrotropin Concentrations: Main Sources, Potential Underlying Biological Mechanisms, and Clinical Implications. Front Endocrinol (Lausanne). 2021 Feb 24;12:619568. doi: 10.3389/fendo.2021.619568. PMID: 33716972; PMCID: PMC7945716.
Meier-Ewert HK, Ridker PM, Rifai N, Regan MM, Price NJ, Dinges DF, Mullington JM. Effect of sleep loss on C-reactive protein, an inflammatory marker of cardiovascular risk. J Am Coll Cardiol. 2004 Feb 18;43(4):678-83. doi: 10.1016/j.jacc.2003.07.050. PMID: 14975482.
van Leeuwen WM, Lehto M, Karisola P, Lindholm H, Luukkonen R, Sallinen M, Härmä M, Porkka-Heiskanen T, Alenius H. Sleep restriction increases the risk of developing cardiovascular diseases by augmenting proinflammatory responses through IL-17 and CRP. PLoS One. 2009;4(2):e4589. doi: 10.1371/journal.pone.0004589. Epub 2009 Feb 25. PMID: 19240794; PMCID: PMC2643002.
Chen C, Liu Y, Cao Z, Yin Z, Zhao F, Lv Y, Liu Z, Mao C, Song S, Liu L, Qu Y, Ji S, Duan J, Wang J, Kraus VB, Zeng Y, Shi X. Combined associations of hs-CRP and cognitive function with all-cause mortality among oldest-old adults in Chinese longevity areas: a prospective cohort study. Immun Ageing. 2019 Nov 17;16:30. doi: 10.1186/s12979-019-0170-y. PMID: 31832073; PMCID: PMC6859603.
Ridker PM, Cook N. Clinical usefulness of very high and very low levels of C-reactive protein across the full range of Framingham Risk Scores. Circulation. 2004 Apr 27;109(16):1955-9. doi: 10.1161/01.CIR.0000125690.80303.A8. Epub 2004 Mar 29. PMID: 15051634.
Ridker PM, Cook N. Clinical usefulness of very high and very low levels of C-reactive protein across the full range of Framingham Risk Scores. Circulation. 2004 Apr 27;109(16):1955-9. doi: 10.1161/01.CIR.0000125690.80303.A8. Epub 2004 Mar 29. PMID: 15051634.
Pearson TA, Mensah GA, Alexander RW, Anderson JL, Cannon RO 3rd, Criqui M, Fadl YY, Fortmann SP, Hong Y, Myers GL, Rifai N, Smith SC Jr, Taubert K, Tracy RP, Vinicor F; Centers for Disease Control and Prevention; American Heart Association. Markers of inflammation and cardiovascular disease: application to clinical and public health practice: A statement for healthcare professionals from the Centers for Disease Control and Prevention and the American Heart Association. Circulation. 2003 Jan 28;107(3):499-511. doi: 10.1161/01.cir.0000052939.59093.45. PMID: 12551878.
Kamath DY, Xavier D, Sigamani A, Pais P. High sensitivity C-reactive protein (hsCRP) & cardiovascular disease: An Indian perspective. Indian J Med Res. 2015 Sep;142(3):261-8. doi: 10.4103/0971-5916.166582. PMID: 26458341; PMCID: PMC4669860.
Tohidi M, Ghasemi A, Hadaegh F, Derakhshan A, Chary A, Azizi F. Age- and sex-specific reference values for fasting serum insulin levels and insulin resistance/sensitivity indices in healthy Iranian adults: Tehran Lipid and Glucose Study. Clin Biochem. 2014 Apr;47(6):432-8. doi: 10.1016/j.clinbiochem.2014.02.007. Epub 2014 Feb 14. PMID: 24530467.
Larsson A, Stridsberg M, Lind L. Reference values for fasting insulin in 75 year old females and males. Clin Biochem. 2013 Aug;46(12):1125-1127. doi: 10.1016/j.clinbiochem.2013.03.024. Epub 2013 Apr 9. PMID: 23578739.
Hammel MC, Stein R, Kratzsch J, Vogel M, Eckert AJ, Triatin RD, Colombo M, Meigen C, Baber R, Stanik J, Spielau U, Stoltze A, Wirkner K, Tönjes A, Snieder H, Holl RW, Stumvoll M, Blüher M, Kiess W, Körner A. Fasting indices of glucose-insulin-metabolism across life span and prediction of glycemic deterioration in children with obesity from new diagnostic cut-offs. Lancet Reg Health Eur. 2023 May 23;30:100652. doi: 10.1016/j.lanepe.2023.100652. PMID: 37465325; PMCID: PMC10350850.
Geoffrey C. Kabat, Mimi Y. Kim, JoAnn E. Manson, Lawrence Lessin, Juan Lin, Sylvia Wassertheil-Smoller, Thomas E. Rohan, White Blood Cell Count and Total and Cause-Specific Mortality in the Women's Health Initiative, American Journal of Epidemiology, Volume 186, Issue 1, 1 July 2017, Pages 63–72, https://doi.org/10.1093/aje/kww226
Ruggiero C, Metter EJ, Cherubini A, Maggio M, Sen R, Najjar SS, Windham GB, Ble A, Senin U, Ferrucci L. White blood cell count and mortality in the Baltimore Longitudinal Study of Aging. J Am Coll Cardiol. 2007 May 8;49(18):1841-50. doi: 10.1016/j.jacc.2007.01.076. Epub 2007 Apr 23. PMID: 17481443; PMCID: PMC2646088.
de Labry LO, Campion EW, Glynn RJ, Vokonas PS. White blood cell count as a predictor of mortality: results over 18 years from the Normative Aging Study. J Clin Epidemiol. 1990;43(2):153-7. doi: 10.1016/0895-4356(90)90178-r. PMID: 2303845.
Furman, D., Campisi, J., Verdin, E. et al. Chronic inflammation in the etiology of disease across the life span. Nat Med 25, 1822–1832 (2019). https://doi.org/10.1038/s41591-019-0675-0
Welsh C, Welsh P, Mark PB, Celis-Morales CA, Lewsey J, Gray SR, Lyall DM, Iliodromiti S, Gill JMR, Pell J, Jhund PS, Sattar N. Association of Total and Differential Leukocyte Counts With Cardiovascular Disease and Mortality in the UK Biobank. Arterioscler Thromb Vasc Biol. 2018 Jun;38(6):1415-1423. doi: 10.1161/ATVBAHA.118.310945. Epub 2018 Apr 26. PMID: 29699973.
Wang, H., Kim, S.J., Lei, Y. et al. Neutrophil extracellular traps in homeostasis and disease. Sig Transduct Target Ther 9, 235 (2024). https://doi.org/10.1038/s41392-024-01933-x
Neves PRDS, Tenório TRDS, Lins TA, Muniz MTC, Pithon-Curi TC, Botero JP, Do Prado WL. Acute effects of high- and low-intensity exercise bouts on leukocyte counts. J Exerc Sci Fit. 2015 Jun;13(1):24-28. doi: 10.1016/j.jesf.2014.11.003. Epub 2015 Feb 7. PMID: 29541095; PMCID: PMC5812872.
Peake JM, Neubauer O, Walsh NP, Simpson RJ. Recovery of the immune system after exercise. J Appl Physiol (1985). 2017 May 1;122(5):1077-1087. doi: 10.1152/japplphysiol.00622.2016. Epub 2016 Dec 1. PMID: 27909225.
Wow, the part about Population Logic realy stood out to me. How do we shift this paradigm without overwhelming the sistem? Such an insightful read!
The protocol gap section hits hard. I've seen this play out with fasting insulin tons of times. A value creeping from 6 to 12 is technically still in range so nothing gets flagged, but that doubling is a massive signal that insulin sensitivity is tanking. The frustrating part is that by the time it crosses into abnormal territory and triggers action, you've already burned years where lifestyle interventions could've been way more effective.