
The Underrated Biomarker That Predicts Stroke & Dementia Risk
It’s not HRV, glucose, or inflammation. But it predicts your risk of stroke, dementia, and kidney decline decades before symptoms.

When was the last time you checked your blood pressure—without being told to?
Most people only learn their numbers when they’re already high.
But here’s what often gets missed:
Blood pressure is one of the strongest, easiest-to-monitor predictors of long-term health.
And ~50% of all U.S. adults already fall above the “normal” range.
That’s not just a cardiovascular issue. It’s a brain, kidney, and aging issue.
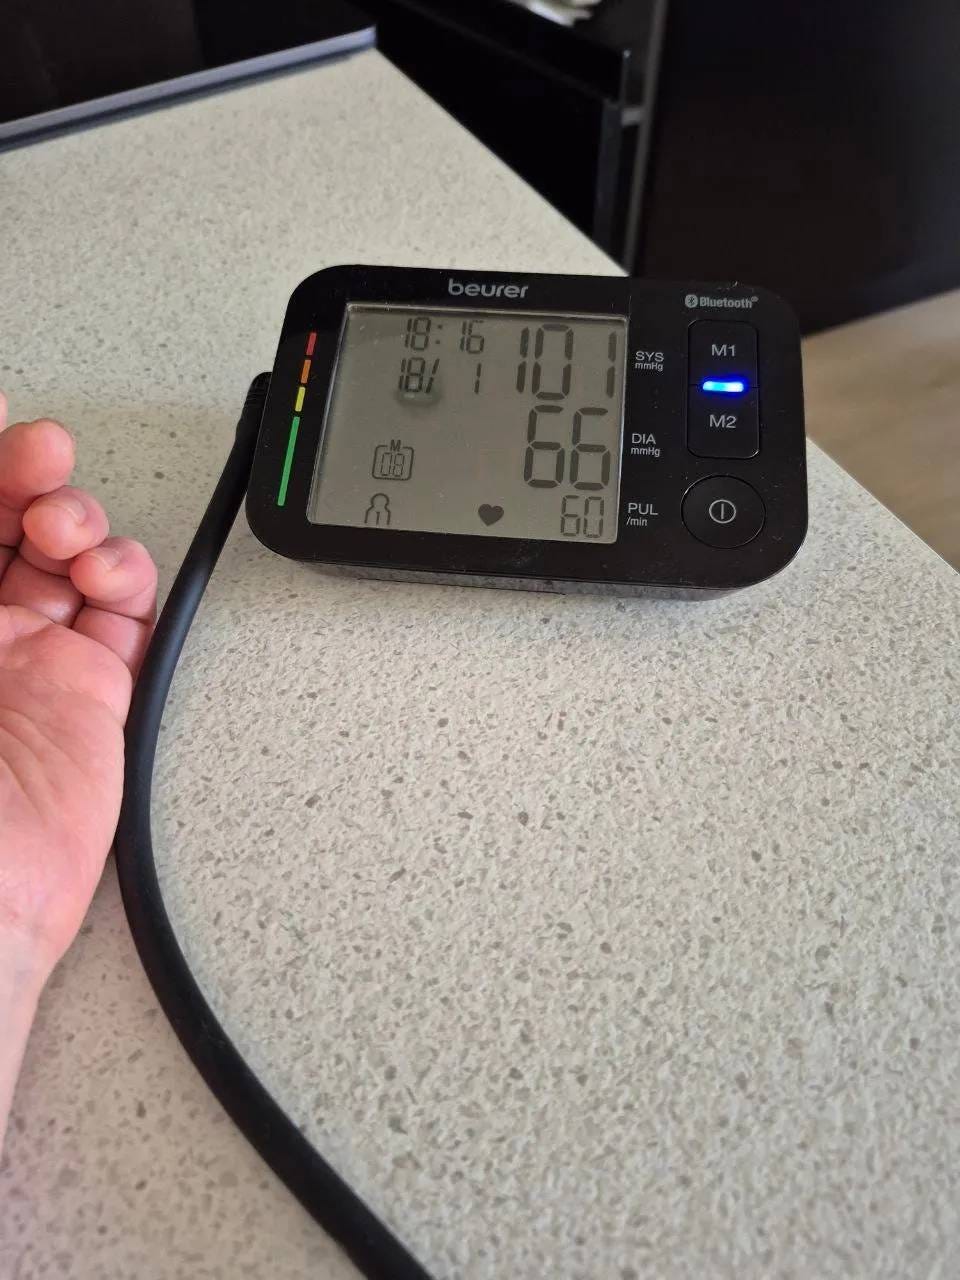
Let’s unpack why—plus the simple protocol I’ve followed to keep mine at 101/66 for 20+ years.
No meds. No salt restriction.
➤ Why should you care about “low-normal” blood pressure?
Blood pressure isn’t just about your heart—it’s about every small vessel in your body, particularly in your brain and kidneys.
When pressure stays high over time, it creates microscopic injuries to these delicate blood vessels.
Think of it like water pressure in your home’s plumbing. Excessive pressure doesn’t cause obvious problems, but it gradually weakens joints, creates tiny leaks, and accelerates wear throughout the pipes.
The research shows:
Every 10 mm Hg rise above 120 systolic (top number) drives up cardiovascular death risk.
Even mid-range levels (like 125–135) are linked to higher stroke and dementia rates.
This means the blood pressure reading you don’t think much about in your 30s-50s meaningfully influences your brain function in your 60s and 70s.
➤ How I’ve kept mine stable for decades (without cutting salt)
I’ve maintained mine at ~100/65 for over 20 years, without cutting salt or taking medications.
Here, the foundation is balance rather than restriction.
—specifically, dietary potassium balance.
When potassium intake stays high, you can often salt to taste without seeing the usual blood pressure consequences. I personally consume 5 to 8 grams of salt per day, which exceeds the recommended daily sodium intake of 2.3 grams of sodium (about 5.8 grams of salt)
One important piece I pay attention to?
I know roughly how much potassium I get from food every day.
One key factor: I do eat mostly whole foods, so I’m not getting extra sodium from packaged items or restaurant meals. This makes it easier to track where all of my sodium comes from—mainly the salt I add during cooking.
If your diet includes more processed foods, you’ll want to factor in that additional sodium when balancing with potassium.
My daily potassium comes primarily from whole foods—leafy greens, avocados, beans, legumes, and other potassium-rich sources. When your potassium intake consistently matches or exceeds your sodium intake, the pressor effect is reduced.
➤ The Science
Potassium and sodium work as opposing forces in your cells’ fluid balance.
Sodium draws water into cells and increases blood volume. Potassium helps cells release excess fluid and maintains vascular elasticity.
When sodium regularly exceeds potassium—which happens in most Western diets—blood vessels lose flexibility and blood volume increases.
However, when potassium matches or exceeds sodium intake, cells maintain better fluid balance.
Blood vessels stay elastic, and kidneys efficiently regulate blood volume.
➤ What is the optimal target for longevity?
As low as possible without hypotension symptoms. For most adults, this means somewhere between 95/60 and 115/75.

I used to worry that readings around 101/66 might be problematically low. Now I understand it’s a longevity advantage that compounds over decades.
The difference between 100/65 and 130/85 may seem small, but over 20-50 years, that translates to dramatically different outcomes for brain health, kidney function, and cardiovascular aging.
Your next steps:
Do you know your baseline numbers? If not:
➤ Get the right equipment this week You want an upper arm monitor, not a wrist or finger device. Wrist and finger monitors are convenient but notoriously inaccurate due to positioning sensitivity and smaller arteries.
Stick with upper arm cuffs that inflate around your bicep.
➤ Look for clinical validation Check the British Hypertension Society or American Heart Association websites for approved models. Make sure it comes with an appropriately sized cuff for your arm circumference.
➤ Establish your baseline
Take three readings, one minute apart, at the same time of day
Record the average as your baseline
Measure 2x weekly for the first month to establish your pattern
Then switch to 2x monthly for ongoing tracking
➤ Track and adjust if needed If your average is consistently above 120/80, start tracking your daily potassium, sodium, and processed food intake while monitoring how different dietary changes affect your readings.
➤ Screen for obstructive sleep apnea if you snore or wake unrefreshed and your BP runs high
If you’re above 140/90 consistently, that’s a good reason to talk with your healthcare provider—and to keep tracking at home so you have a more representative picture over time.
I hope this gives you a different lens on those two numbers your doctor reads out at every visit.
Small tracking habits like this compound in ways that may surprise you—and they help you maintain the energy, memory, and clarity you need for the relationships and activities you care about most
Speak soon,
—Kat
P.S. You can play an active role in how your brain ages by how you handle blood pressure, sleep, and everyday habits. If you want practical, evidence-based frameworks to guide that process, subscribe to The Longevity Vault here:
References
Bergmann F, et al. Systolic blood pressure targets below 120 mm Hg are associated with reduced mortality: A meta-analysis. J Intern Med. 2025 May;297(5):479-491.
Liu, J., et al. (2024). Lowering systolic blood pressure to less than 120 mm Hg versus less than 140 mm Hg in patients with high cardiovascular risk with and without diabetes or previous stroke: An open-label, blinded-outcome, randomised trial. The Lancet, 404(10449), 245–255.
Guo X, et al. Benefit-harm trade-offs of intensive blood pressure control versus standard blood pressure control on cardiovascular and renal outcomes: an individual participant data analysis of randomised controlled trials. Lancet. 2025 Sep 6;406(10507):1009-1019.
Song Q, et al. Intensive Blood Pressure Control in Older Patients With Hypertension: 6-Year Results of the STEP Trial. J Am Coll Cardiol. 2025 Oct 28;86(17):1421-1433.
Bi Y, et al; BPROAD Research Group. Intensive Blood-Pressure Control in Patients with Type 2 Diabetes. N Engl J Med. 2025 Mar 27;392(12):1155-1167.
Wang, H., et al. (2025). Blood pressure levels and risk of intracerebral hemorrhage in the general population: Evidence from a large prospective cohort study. Journal of Stroke and Cerebrovascular Diseases, 34(12), 108476.
Dong, X., et al. (2025). Benefit and harm of intensive blood pressure control by cardiovascular risk. Hypertension, 82(8), 1392–1400.
Whelton PK, O’Connell S, Mills KT, He J. Optimal Antihypertensive Systolic Blood Pressure: A Systematic Review and Meta-Analysis. Hypertension. 2024 Nov;81(11):2329-2339.
Verdecchia P, Angeli F, Reboldi G. Baseline risk and outcome benefit from intensive blood pressure targeting. A systematic review. Eur J Intern Med. 2025 Dec;142:106409.
Elfassy T, German CA, Muntner P, Choi E, Contreras G, Shimbo D, Yang E. Blood Pressure and Cardiovascular Disease Mortality Among US Adults: A Sex-Stratified Analysis, 1999-2019. Hypertension. 2023 Jul;80(7):1452-1462.